Danmarks Statistik har ett API som kan hittas här. Liksom SCB så har Dst en sida där man kan få hjälp med att bygga JSON-frågan till API:et. Den sidan hittar man här.
Beroende på vilken typ av fråga man ställer så måste man använda olika URL:er i POST-anropet till Dst:
- Hämta ämnesområden: https://api.statbank.dk/v1/subjects
- Lista tabeller inom ett ämnesområde: https://api.statbank.dk/v1/tables
- Hämta metainfo om en tabell: https://api.statbank.dk/v1/tableinfo
- Ladda hem en tabell: https://api.statbank.dk/v1/data
Till att börja med kan vi ladda hem en tabell med alla ämnesområden som finns i Danmark Statistiks databas:
library(jsonlite)
library(httr)
library(magrittr)
library(tidyr)
library(purrr)
library(tibble)


bodytxt <- '{
   "lang": "en",
   "format": "JSON"
}'


bodytxt_list <- jsonlite::fromJSON(bodytxt,
                                   simplifyVector = FALSE,
                                   simplifyDataFrame = FALSE)

req <- POST("https://api.statbank.dk/v1/subjects",
            body = bodytxt_list, encode = "json", verbose())

stop_for_status(req)
content(req)
dfanswer <- fromJSON(content(req))[, 1:4]

head(dfanswer, 13)
#    id                               description active hasSubjects
# 1  02                  Population and elections   TRUE        TRUE
# 2  05                         Living conditions   TRUE        TRUE
# 3  03                   Education and knowledge   TRUE        TRUE
# 4  18               Culture and National Church   TRUE        TRUE
# 5  04                 Labour, income and wealth   TRUE        TRUE
# 6  06                    Prices and consumption   TRUE        TRUE
# 7  14 National accounts and government finances   TRUE        TRUE
# 8  16                   Money and credit market   TRUE        TRUE
# 9  13                          External economy   TRUE        TRUE
# 10 07                Business sector in general   TRUE        TRUE
# 11 11                          Business sectors   TRUE        TRUE
# 12 01         Geography, environment and energy   TRUE        TRUE
# 13 19                                     Other   TRUE        TRUE
Låt oss ta reda på vilka tabeller det finns under ämnet “Population and elections” (id = “02”):
bodytxt <- '{
  "lang": "en",
  "subjects": [
    "02"
    ],
  "format": "JSON"
}'


bodytxt_list <- jsonlite::fromJSON(bodytxt,
                                   simplifyVector = FALSE,
                                   simplifyDataFrame = FALSE)

req <- POST("https://api.statbank.dk/v1/tables",
            body = bodytxt_list, encode = "json", verbose())

stop_for_status(req)
content(req)
dfanswer <- fromJSON(content(req))

dfanswer <- as_data_frame(dfanswer)

head(dfanswer, 10)

# A tibble: 13 x 8
#    id     text                                              unit  updated          firstPeriod latestPeriod active variables
#    <chr>  <chr>                                             <chr> <chr>            <chr>       <chr>        <lgl>  <list>
#  1 FOLK1A Population at the first day of the quarter        numb~ 2018-05-08T08:0~ 2008Q1      2018Q2       TRUE   <chr [5]>
#  2 FOLK1B Population at the first day of the quarter        numb~ 2018-05-08T08:0~ 2008Q1      2018Q2       TRUE   <chr [5]>
#  3 FOLK1C Population at the first day of the quarter        numb~ 2018-05-08T08:0~ 2008Q1      2018Q2       TRUE   <chr [6]>
#  4 FOLK1D Population at the first day of the quarter        numb~ 2018-05-08T08:0~ 2008Q1      2018Q2       TRUE   <chr [5]>
#  5 FOLK1E Population at the first day of the quarter        numb~ 2018-05-08T08:0~ 2008Q1      2018Q2       TRUE   <chr [5]>
#  6 FOLK2  Population 1. January                             numb~ 2018-02-09T08:0~ 1980        2018         TRUE   <chr [6]>
#  7 FOLK3  Population 1. January                             numb~ 2018-02-09T08:0~ 2008        2018         TRUE   <chr [4]>
#  8 FT     Population figures from the censuses              numb~ 2018-02-09T08:0~ 1769        2018         TRUE   <chr [2]>
#  9 BEF5F  People born in Faroe Islands and living in Denma~ numb~ 2018-02-09T08:0~ 2008        2018         TRUE   <chr [4]>
# 10 BEF5G  People born in Greenland and living in Denmark 1~ numb~ 2018-02-09T08:0~ 2008        2018         TRUE   <chr [4]>
# 11 BEF5   Population 1. January                             numb~ 2018-02-09T08:0~ 1990        2018         TRUE   <chr [4]>
# 12 BY3    Population 1. January                             -     2018-06-11T08:0~ 2017        2017         TRUE   <chr [3]>
# 13 BY1    Population 1. January                             numb~ 2018-04-18T08:0~ 2010        2018         TRUE   <chr [4]>
Går vi igenom tabellen så upptäcker vi att det finns en tabell med namn “BEF5” som visar befolkning den 1 januari. Vi ber Dst att visa metainfo om tabellen med nedanstående fråga:
bodytxt <- '{
"lang": "en",
"table": "BEF5",
"format": "JSON"
}'
bodytxt_list <- jsonlite::fromJSON(bodytxt,
simplifyVector = FALSE,
simplifyDataFrame = FALSE)
req <- POST("https://api.statbank.dk/v1/tableinfo",
body = bodytxt_list, encode = "json", verbose())
stop_for_status(req)
content(req)
lanswer <- fromJSON(content(req))
dfanswer <- as_data_frame(lanswer[["variables"]])
head(dfanswer)
# # A tibble: 4 x 6
# id text elimination time values map
# <chr> <chr> <lgl> <lgl> <list> <chr>
# 1 KØN sex TRUE FALSE <data.frame [2 x 2]> NA
# 2 ALDER age TRUE FALSE <data.frame [126 x 2]> NA
# 3 FODLAND country of birth TRUE FALSE <data.frame [239 x 2]> Verden_dk2
# 4 Tid time FALSE TRUE <data.frame [29 x 2]> NA
# Notera att kolumnen "values" har en listvariabel som innehåller en dataframe. Vi plockar fram dessa dataframes med hjälp av purrr-paketets unnest-funktion:
unnest(dfanswer)
# # A tibble: 396 x 7
# id text elimination time map id1 text1
# <chr> <chr> <lgl> <lgl> <chr> <chr> <chr>
# 1 KØN sex TRUE FALSE NA M Men
# 2 KØN sex TRUE FALSE NA K Women
# 3 ALDER age TRUE FALSE NA 0 0 years
# 4 ALDER age TRUE FALSE NA 1 1 year
# 5 ALDER age TRUE FALSE NA 2 2 years
# 6 ALDER age TRUE FALSE NA 3 3 years
# 7 ALDER age TRUE FALSE NA 4 4 years
# 8 ALDER age TRUE FALSE NA 5 5 years
# 9 ALDER age TRUE FALSE NA 6 6 years
# 10 ALDER age TRUE FALSE NA 7 7 years
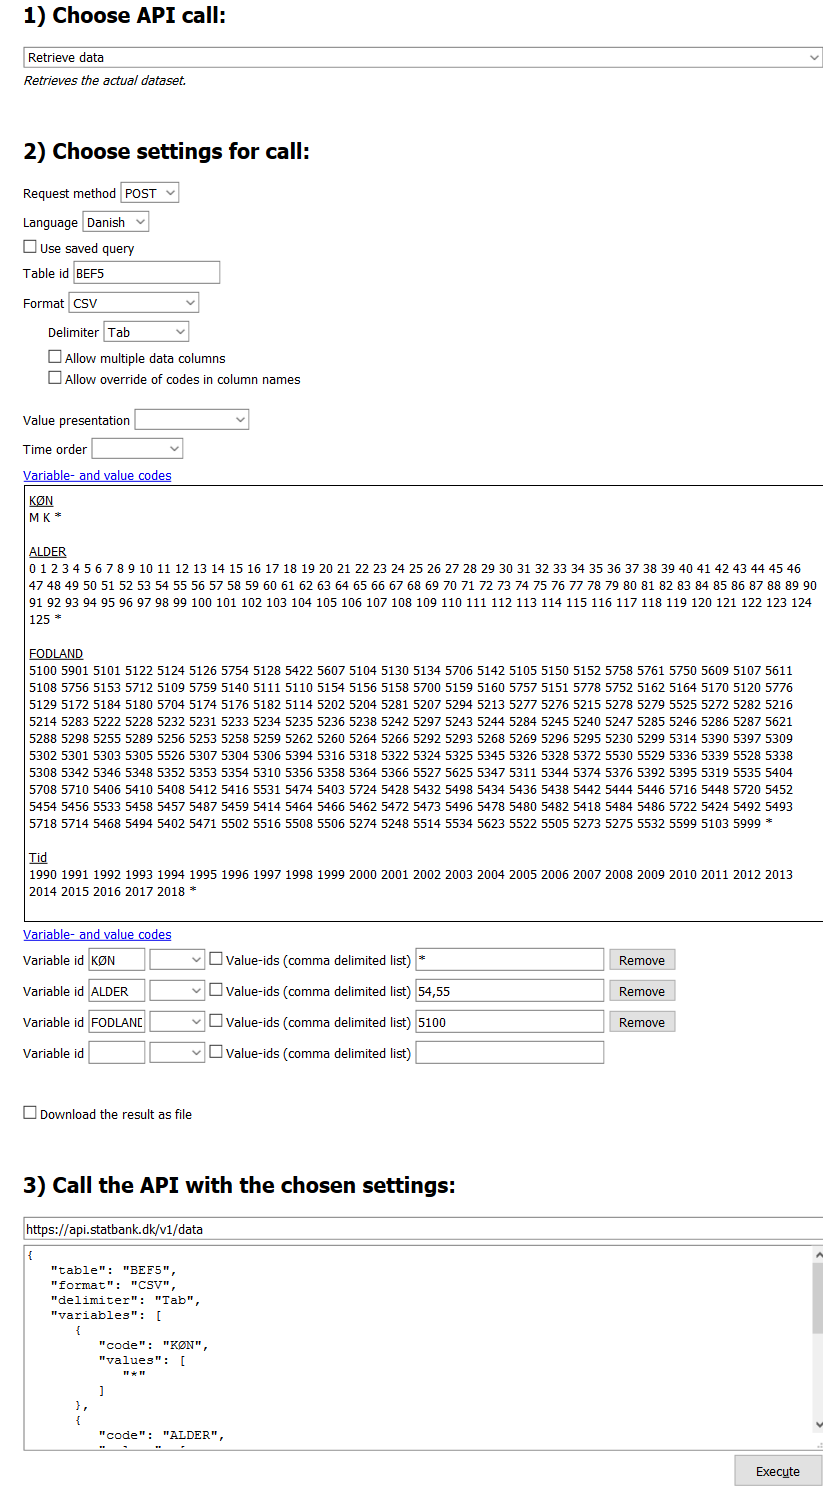
# # ... with 386 more rowsNu är det dags att hämta hem data. Det gör man genom att bygga frågan med Dst:s hjälpsida. Nedan har vi valt befolkning som är 54 och 55 år gamla och vi har valt båda könen (vilket markeras med en asterix) och ett födelseland (Danmark).
Gå till Dst:s konsolsida, se till så att “Choose API call:” är satt till Retrive data, “Table id” är satt till BEF5 och “Language” till English.
Variabler kan väljas genom att man klickar på dem i rutan" Variable- and value codes"
bodytxt <- '{
  "lang": "en",
"table": "BEF5",
"format": "CSV",
"valuePresentation": "Value",
"delimiter": "Tab",
"variables": [
{
  "code": "ALDER",
  "values": [
  "54",
  "55"
  ]
},
  {
  "code": "KØN",
  "values": [
  "*"
  ]
  },
  {
  "code": "FODLAND",
  "values": [
  "5100"
  ]

  },
  {
  "code": "Tid",
  "values": [
  "2017",
  "2016"
  ]
  }
  ]
  }'


bodytxt_list <- jsonlite::fromJSON(bodytxt,
                                   simplifyVector = FALSE,
                                   simplifyDataFrame = FALSE)

req <- POST("https://api.statbank.dk/v1/data",
            body = bodytxt_list, encode = "json", verbose())

stop_for_status(req)
lanswer <- content(req)

dfanswer <- as_data_frame(lanswer)

dfanswer <- separate(dfanswer, col = 1, sep = "\t", into = unlist(strsplit(names(dfanswer), split = "\t")))

head(dfanswer, 8)

# # A tibble: 8 x 5
#   ALDER    KØN   FODLAND TID   INDHOLD
#   <chr>    <chr> <chr>   <chr> <chr>
# 1 54 years Men   Denmark 2016  33317
# 2 54 years Men   Denmark 2017  34051
# 3 54 years Women Denmark 2016  33328
# 4 54 years Women Denmark 2017  34029
# 5 55 years Men   Denmark 2016  33127
# 6 55 years Men   Denmark 2017  33127
# 7 55 years Women Denmark 2016  33102
# 8 55 years Women Denmark 2017  33228